1. Game Overview & MVP
Analysis Summary
-
▲
This fixture concluded the NBL U16 season, serving as a critical diagnostic event for the Academy’s technical trajectory. While the final 88-50 scoreline suggests a comfortable outing, the victory was predicated on a vital mid-game tactical evolution. An initial lack of defensive urgency—manifested as a "lazy zone"—allowed Team Alpha to remain competitive through the first period. The technical staff’s decision to pivot to an aggressive man-to-man defense functioned as the primary catalyst for the result, disrupting Team Alpha’s rhythm and fueling the transition game. The dominant 33-12 surge in the second quarter effectively neutralized the opposition, shifting the game from a statistical deadlock to a demonstration of physical and tactical superiority. .
-
▲
Q1 Traded Blows: The tightest quarter of the night: four lead changes and five ties, with Team Beta landing all three of their threes and running off ten straight to lead 10-1. Team Alpha answered from the line, 7 of 13, and edged it 23-22.
-
▲
Q2 Decisive Surge: The game was settled here. Thirteen of nineteen paint attempts fell for a 33-12 quarter, and Team Beta managed five field goals and two free throws all period. The lead went from one point to twenty-two.
-
▲
Q3 Defensive Stranglehold: Scoring dried to 12 points on 5 of 12 inside, but it did not matter: Team Beta were held to a single field goal and one free throw, three points in ten minutes, the lowest quarter either side managed.
-
▲
Q4 Closed Out: Nine of fourteen inside restored the rhythm and eight steals, the most in any quarter, turned defence straight into offence for a 20-13 finish. The lead peaked at 38 points at 82-44 before the final whistle.
Quarter by Quarter
Game MVP
Player A
EFF Rating: 20 (Highest)
TURNOVERS: 2 (Game Average)
REBOUNDS: 11 (Game Low)
POINTS: 16 (Game High)
Player A is designated Game MVP not merely for his "Double-Double", but for his elite efficiency-to-volume ratio. While Player B led in points, his 24 points required 19 field goal attempts; conversely, Player A’s 16 points came on just 14 attempts with zero missed free throws, providing the interior stability required to anchor the man-to-man transition.
MVP Efficiency vs. Actual Stats
This comparative analysis benchmarks the MVP’s performance against the team averag, highlighting the disparity between elite individual execution and general team output.
| Metric | Player A (MVP) | Top Scorer (Player B) | Team Average | |
|---|---|---|---|---|
| EFF Rating | 20 | 12 | 8.45 | |
| Points (PTS) | 16 | 24 (Highest) | 8 | |
| Total Rebounds (RT) | 11 | 2 | 3.9 | |
| Steals (ST) | 0 | 0 | 1.45 | Player F: 5 (Highest) |
| Turnovers (TO) | 2 | 2 | 1.36 | |
| True Shooting % | 57% | 53% | 48.1% |
Quarter Score Comparison
Team Efficiency (EFF) by Quarter
2. Team vs. Opponent Statistical Duel
A direct comparison of key production metrics (made shots and rebounds) for the entire game.
43 - 13
Total Rebounds (RT)
TEAM BETA ADVANTAGE (+30)
38 - 27
Field Goals Made (FGM)
TEAM BETA ADVANTAGE (+11)
0 - 5
Three Pointers Made (3PM)
TEAM ALPHA ADVANTAGE (+5)
12 - 5
Free Throws Made (FTM)
TEAM BETA ADVANTAGE (+7)
Note: The staggering +30 rebound differential was the physical manifestation of the man-to-man shift. By winning individual box-out battles and forcing Team Alpha into lower-percentage, contested looks, Team Beta effectively controlled the glass and neutralized Team Alpha's perimeter advantage.
3. Shot Performance Analysis
61%
2P% In-Paint (35/57)
35 of 57 inside carried the whole offence, and every quarter but the third cleared 60%.
60%
2P% Out-Paint (3/5)
Only five mid-range attempts all game, three converted; almost no counter when the key is walled off.
50%
Free Throw % (12/24)
12 of 24 from the line gave back the equivalent of a full quarter of scoring.
0%
3P% (0/17)
0 for 17 across all four quarters, while Team Beta hit three in the first alone.
Shots Taken vs. Made by Type
4. Player Contribution
Top Scorers (Points)
Top Rebounders (Total)
Top Turnovers (TO)
Top Stealers (ST)
5. Quarter-by-Quarter Shot Charts
Visualizing shot selection and results during the game flow.
Q1
(23-22)
All Inside
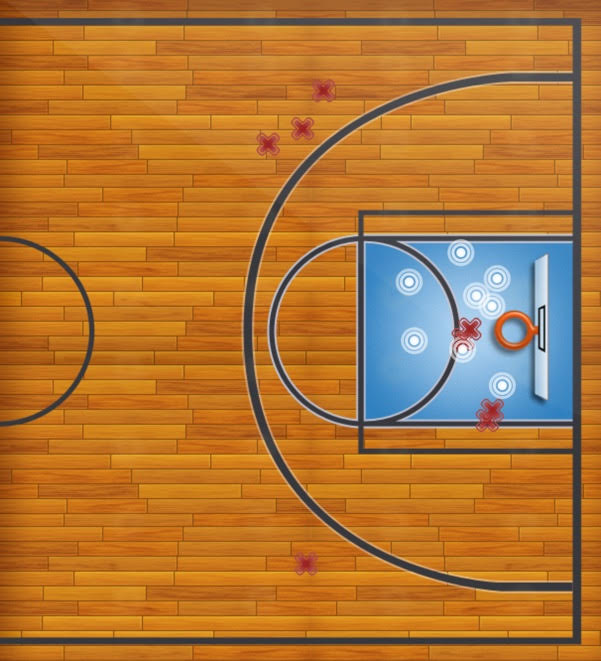
Every field goal attempt came in the paint, eight of twelve dropping, while four three-point tries all missed. Thirteen trips to the line produced seven points.
Q2
(33-12)
Paint Avalanche
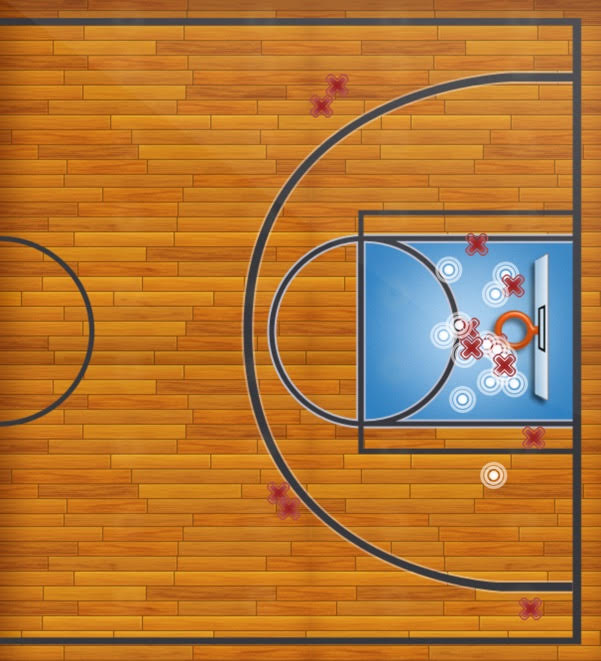
Nineteen paint attempts yielded thirteen makes, the densest and most productive cluster of the game, and the single stretch that decided the result outright.
Q3
(12-3)
Cold Interior
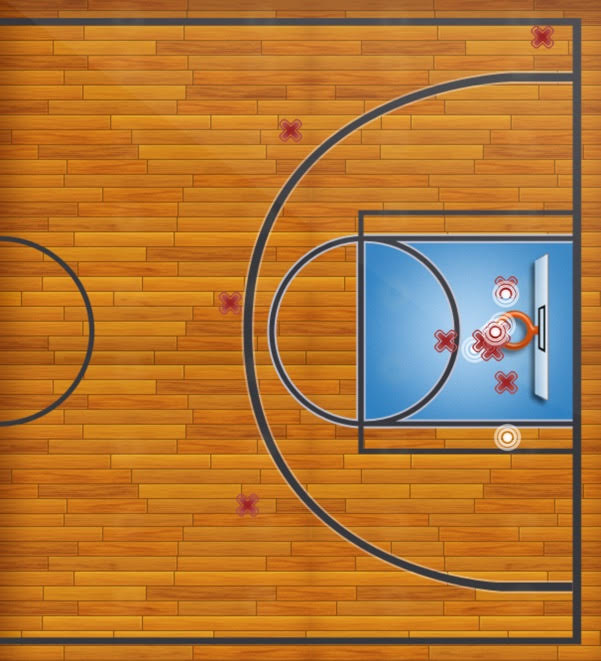
Paint accuracy fell to five of twelve as Team Beta packed the key, and four more perimeter looks failed. Only one free throw was attempted all quarter.
Q4
(20-13)
Restored Rhythm
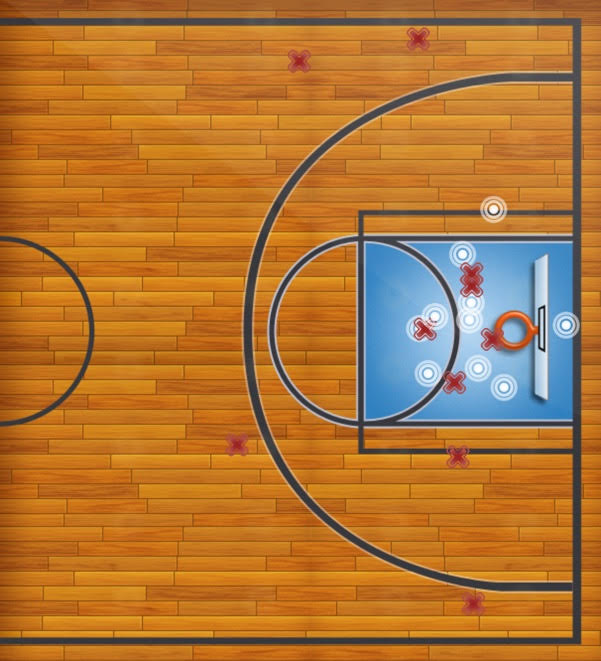
Nine of fourteen inside rebuilt the interior edge, though four further three-point attempts extended the arc drought to seventeen straight misses across the whole game.
6. Key Takeaways & Action Plan
Final Comment
- The 88-50 victory is a strong seasonal closer but highlights an "offensive bottleneck." The reliance on a +30 rebounding margin to mask a 0% 3PT performance is unsustainable against elite competition with competent rim protection.
1. Strenghts
- Interior scoring efficiency (61%), dominant rebounding identity, and tactical adaptability (Man-to-Man transition).
2. Weakness
- Perimeter shooting (0/17 3PT), free throw consistency (50%).
3. Critical Liabilities
- Technical Ceiling: Total 3PT dependency. Against elite rim protectors, this interior-only offense will stall. The +30 rebound margin was the only factor preventing a closer contest.